
Top 12 Business Applications of an Average Calculator
.webp)
A business organization has to deal with multiple data to make informed business decisions. In this case, it requires accurate calculation of different data sets. Average is a middle value in a set of numbers. It is calculated by dividing the total number counts by the total value.
It's a crucial metric used to find how well a business organization performs. Utilizing an average calculator helps organizations easily identify important average metrics. It can be anything related to budgeting, sales performance, average inventory, etc. This calculation aids businesses to get an overview of their average in different domains.
Key Takeaways
- Understand How Average Calculator Helps Businesses
- Identify the Top 12 Business Applications of an Average Calculator
- A Step-by-Step Guide to Using an Average Calculator
Business Applications of an Average Calculator
1. Budgeting
Budgeting is a vital aspect of financially planning the company’s revenue and expenses. Generally, it involves specific goals and periods to allocate financial resources. Here average calculation plays a prominent role where organizations need to determine how much they allocate for certain things and how much average income they generate from certain revenue sources.
Let’s find this with an example: A business firm predicts the following incomes and expenses for the next quarter:
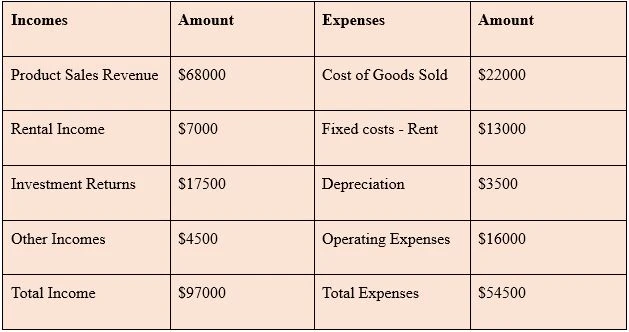
Average Income = Total income/Total number of income sources
- = $97000/4
- = $24250
Average Expenses = Total Expenses/Total number of expenses
- = $54500/4
- = $13625
Average Profit = $24250 - $13625
- = $10625
According to this example, the company can identify its average income, expenses, and profit prediction for the next quarter. This seems solid because the company makes more profit than losses. According to this metric, the business owner and stakeholders can make budgeting plans and strategies.
2. Sales Performance
Finding average sales performance is crucial for various reasons. Companies can able to analyze their sales performance for a specific period by using this metric. It includes average sales revenue, sales volume, and customer acquisition for the specific time frame.
Let’s find this below example: A company’s last month sales performance is identified as:
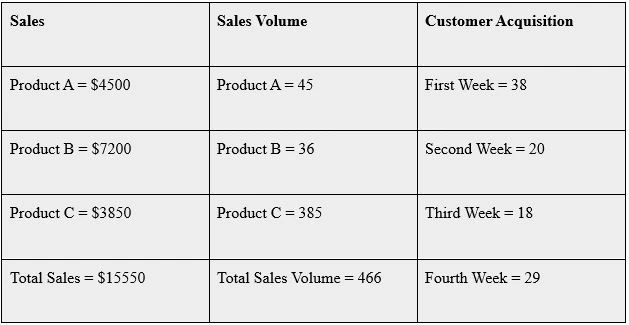
- Average Sales Price of Product A= $4500/45 = $100
- Average Sales Price of Product B = $7200/36 = $200
- Average Sales Price of Product C = $3850/385 = $10
- Average Sales Price of All Products = $15550/466 = $33.37
- Average Sales Revenue = $15550/3 = $5183.33
- Average Sales Volume = 466/3 = 155.33
- Average Customer Acquisition per week = 105/4 = 26.25, means 26 customers
This overview of sales performance helps the company understand better about their product performance as a whole. With the help of an average calculator, they can easily find out the average sales price, revenue, and customer acquisition for a specific period.
3. Customer Satisfaction
Average customer satisfaction is an important metric for making proper business decisions. This will help identify what exactly customers prefer from the products or services. Based on customer satisfaction surveys, businesses can understand the level of acceptance of their products or services.
The following example interprets 5 different customer groups of different ages rating the product of a company from a scale of 0 to 10. Zero is the least and 10 is the highest satisfactory level:
- 500 Repeat Customers – Rated 9
- 350 Loyal Customers – Rated 9.5
- 150 New Customers – Rated 8
- 80 Disengaged Customers – Rated 4
- 70 potential Customers – Rated 7.5
According to the different customer groups, the average customer satisfaction is as follows:
- Average Customer Satisfaction = Total Rating / Number of Customer Groups
- = 38/5
- = 7.6
So, the average customer satisfaction is identified as 7.6 in this case. Based on this rating, the company has to plan well on improving customer satisfaction. They should focus more on disengaged customers which impacts the company's average rating that displays on the Google My Business profile.
4. Employee Productivity
Employee productivity is one of the prominent aspects that directly influences in achieving an organization’s mission. It's measured at different levels. Worker’s productivity in the manufacturing section is measured by the number of units effectively produced by manufacturing staff,
Worker’s productivity in operation or administration is measured by the number of tasks they effectively complete. This applies to all sections or divisions of a company.
Let’s find an example for understanding employee productivity:
A. Manufacturing Section
- Total units manufactured by workers – 900
- Total number of workers – 50
- Hours worked for production – 58 hours
Average units produced by a worker = Total units manufactured by workers / Number of Workers
- = 900/50
- = 18 units
Average hours worked by a worker = Total work hours/number of workers
- = 58/50
- = 1.16 hours
Productivity percentage of a worker = (Average units produced by a worker / Average hours worked by a worker) * 100%
- = (18/1.16) *100%
- = 15.52% productivity
B. Administration Section
- Total number of tasks completed – 1300
- Total number of admin staff – 25
- Total hours worked -30
Average Task completed by an admin staff = Total tasks completed / Total number of admin staff
- = 1300/25
- = 52 tasks
Average hours worked by an admin staff = Total hours worked / Number of staff
- = 30/25
- = 1.2 hours
Productivity percentage of an admin staff = (Average Task completed by an admin staff / Average hours worked) *100%
- = (52/1.2) *100%
- = 43.33% Productivity
Based on the above calculation, the productivity level of an admin staff is comparatively better than the manufacturing staff. The average productivity percentage of employees is an important metric for planning training, job skill development, and other productivity enhancement programs.
When calculating productivity, it is also important to consider the different levels of risk and toughness in completing the work. Manufacturing is relatively harder than administration work. So, comparing the same section in different time frames is appropriate to make decisions.
5. Inventory Management
Managing the inventory of a business is a crucial task where firms can leverage an average calculator to perform certain inventory management tasks. It involves maintaining inventory levels, identifying lead time, average holding costs, and many others.
The following example of a company explains this well:
- Starting inventory of the month – 230 Units
- Ending inventory of the month – 180 Units
- Total cost of goods sold (COGS) - $5200
- Average cost of inventory for the month - $1040
- Total lead time for the orders received in the month – 40 days
- Total orders received in the month – 8 orders
- Total inventory holding cost - $600
A. Average Inventory Level = ((Starting Inventory + Ending Inventory)/2)
- = ((230+180)/2)
- = 205 Units
B. Average Inventory Turnover = COGS / Average inventory cost
- = $5200 / $1040
- = 5 times a month
C. Average Lead Time = Total lead time / Total received orders
- = 40 days / 8 orders
- = 5 days
D. Average Holding Cost = Total inventory holding cost / Average inventory level
- = $600 / 205 units
- = $2.93 per unit
Now, you may get a clear picture of average calculation in different areas of inventory management. This calculation is helpful to manage a company’s inventory effectively. Using an average calculator can simplify this task.
6. Cost Analysis
Analyzing different costs of a business is mandatory for making financial decisions. Costs related to production, operations, and miscellaneous services influence the profit of a company. Calculating the average cost is useful to get an overall idea and plan cost-cutting options strategically.
Let’s see an example to understand this:
A manufacturing company sells their products to their customers and the following details are fetched for the last 6 months
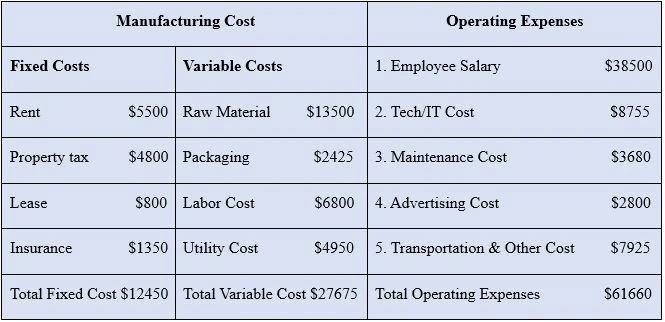
Total number of units manufactured in these 6 months = 685
Total Manufacturing Cost = Total Fixed Cost + Total Variable Cost
- = $12450 + $27675
- = $40125
Average Fixed Cost = Total Fixed Cost / Quantity of Units Manufactured
- = $12450 / 685
- = $18.175
Average Variable Cost = Total Variable Cost / Quantity of Units Manufactured
- = $27675 / 685
- = $40.40
Average Manufacturing Cost = Total Manufacturing Cost / Quantity of Units Manufactured
- = $40125 / 685
- = $58.57
Average manufacturing cost can be also calculated by summing average fixed and variable costs.
Average Operating Expenses = Total Operating Expenses / Number of Units Produced
- = $61660 / 685
- = $90.01
The average cost of the company to produce a product = Average Manufacturing Cost + Average Operating Expenses
- = $58.57 + $90.01
- = $148.58
Here, the company can easily identify the average cost of producing an item. This will help them determine the sales price accurately. A 1-15% sales tax should be considered when determining the price. Assuming an 8% exclusive sales tax with a 10% profit margin can make the price as:
Average Price + Sales Tax + Profit = $148.58 + $11.89 + $14.86 = $175.33 or $175
7. Financial Forecasting
Financial forecasting or prediction is crucial to planning the financial matters of a company. The average calculation of different financial values is useful in this matter. Companies perform different analyses based on historical data such as average profit, ROI, cash flow, and many others.
Let’s look at the below example to understand this clearly:
A company’s past 6 months data is as follows:
Revenue per month
- Month 1 - $58700
- Month 2 - $37985
- Month 3 - $55710
- Month 4 - $71065
- Month 5 - $43668
- Month 6 - $60020
- Total Revenue = $327148
Expenses per month
- Month 1 - $29855
- Month 2 - $14770
- Month 3 - $22885
- Month 4 - $36440
- Month 5 - $18600
- Month 6 - $23471
- Total Expenses = $146021
Cash Inflows
- Month 1 - $62115
- Month 2 - $41200
- Month 3 - $59880
- Month 4 - $73668
- Month 5 - $54100
- Month 6 - $62073
- Total Cash Inflows = $353036
Cash Outflows
- Month 1 - $36520
- Month 2 - $15300
- Month 3 - $28550
- Month 4 - $39922
- Month 5 - $20055
- Month 6 - $24110
- Total Cash Outflows = $164457
Total Investment Cost - $163000
Now let's calculate the following:
i) Average Revenue per Month = Total Revenue / Number of Months
- = $327148 / 6
- = $ 54524.66
ii) Average Expenses per Month = Total Expenses / Number of Months
- = $146021 / 6
- = $24336.83
iii) Average Profit per Month = Average Revenue per Month – Average Expenses per Month
- = $54524.66 – $24336.83
- = $30187.83
iv) Average ROI per Month = (Average Profit per Month / Total investment cost) * 100%
- = ($30187.83 / $163000) * 100%
- = 18.52%
v) Average Cash Inflow per Month = Total Cash Inflow / Number of Months
- = $353036 / 6
- = $ 58839.33
vi) Average Cash Outflow per Month = Total Cash Outflow / Number of Months
- = $164457 / 6
- = $27409.5
vii) Average Cashflow per Month = Average Cash Inflow – Average Cash Outflow
- = $58839.33 - $27409.5
- = $31429.83
According to these values, the company can find out future financial predictions. A positive average profit, cash flow, and ROI (return on investment) is a good indicator that the company’s financial performance is acceptable.
8. Marketing ROI
Marketing ROI is an important metric that companies focus on to identify how much return they get for marketing expenses. This metric is crucial to identify successful campaigns and implement necessary marketing plans.
The following example will explain this clearly:
A company’s Marketing return and expenses for the last quarter are:
Marketing Return from 3 different campaigns
- Campaign 1 - $4500
- Campaign 2 - $3000
- Campaign 3 - $7600
Marketing Expenses for those 3 different campaigns
- Campaign 1 - $1200
- Campaign 2 - $850
- Campaign 3 - $2100
Average Marketing Return = Total Marketing Return / Number of Campaigns
- = $15100 / 3
- = $5033.33
Average Marketing Expenses = Total Marketing Expenses / Number of Campaigns
- = $4150 / 3
- = $1383.33
Average Marketing ROI = ((Average Marketing Return – Average Marketing Expenses) / Average Marketing Expenses) * 100%
- = (($5033.33 - $1383.33) / $1383.33) * 100%
- = 263.85%
The ROI value is 263.85% that shows, for every dollar spent by the company, they get 2.64 dollars as a return. This is a positive return on the investment. Leveraging an average calculator is useful in calculating the marketing ROI accurately.
Based on this data, the company can strategically plan its marketing campaigns which help them improve returns in the future.
9. Customer Lifetime Value (CLV)
The customer lifetime value is considered one of the crucial metrics for businesses. It shows the profit level of businesses from the customers over the relationship period. The following example can explain this well:
- Average Purchase Value - $199
- Average Purchase Frequency – 3 Purchases per Month
- Customer Value – Total revenue generated by a customer for the specific period
- Average Customer Lifespan – 12 Months
Customer Value = Average Purchase Value * Average Purchase Frequency
- = $199 * 3
- = $597
Customer Lifetime Value = Customer Value * Average Customer Lifespan
- = $597 * 12 Months
- = $7164
This means a customer buys the company product 3 times a month with an average value of $199. Plus, retaining customers for 12 months equals generating $7164 as customer lifetime value.
An average calculator helps identify the average purchase value, lifespan, and frequency for several customers to see the customer value as a whole.
10. Quality Control
Quality control is important to define whether the required standards are in place. The products or services require certain quality standards and ensuring them is a crucial task of quality control staff. Some common average calculations are required in the following key areas:
- Average Defect Rate Identification
- Average Compliance Rates
- Average Inspections Costs
- Average Repair Costs
Let’s see an example to understand this further:
A company’s last 3 months details are as follows:
Units Produced and Tested
- Month 1 – 620
- Month 2 – 750
- Month 3 - 670
Defects Identified
- Month 1 – 14
- Month 2 – 11
- Month 3 – 17
Inspection Cost
- Month 1 - $930
- Month 2 - $1125
- Month 3 - $1005
Repair Cost
- Month 1 - $1085
- Month 2 - $1312.5
- Month 3 - $1172.5
Average Defect Per Month = Total defects / Number of months
- = 42 / 3
- = 14
Average Number of Products Tested per Month = Total Products Tested / Number of Months
- = 2040 / 3
- = 680
Average Defect Rate = Total defect products / Number of products tested
- = 42 / 2040
- = 0.02 or 2%
Products that comply with quality standards = Number of tested products – defective products
- = 2040 – 42
- = 1998 Units
Average Compliance Rate = (Total standard products without defects / Total products) * 100%
- = (1998 / 2040) * 100%
- = 97.9% or 98%
Average Inspection Cost per Month = Total Inspection Cost / Number of Months
- = $3060 / 3
- = $1020
Average Inspection Cost per Unit = Total Inspection Cost / Total units inspected
- = $3060 / 2040
- = $1.5
Average Repair Cost per Month = Total Repair Cost / Number of Months
- = $3570 / 3
- = $1190
Average Repair Cost per Unit = Total Repair Cost / Total Number of Defective Units
- = $3570 / 42 units
- = $85
This average calculation is so crucial to ensure compliance in the organization. Leveraging an average calculator can be useful to quickly perform the calculations.
11. Website Traffic Analysis
A website is handy for companies to target their customers online. Website traffic is vital data that indicates the number of people (target customers) who land on the company’s website or web page. Finding the average visits is helpful to analyze the traffic and increase sales.
Let’s see this example:
A company’s last 6 months web traffic is shown below:
- Month 1 – 125200 Page Views
- Month 2 – 148500 Page Views
- Month 3 – 127800 Page Views
- Month 4 – 142000 Page Views
- Month 5 – 139000 Page Views
- Month 6 – 178000 Page Views
According to the data for the last six months, the website generates a good flow of traffic which increased in the latest month.
Average Web Traffic per Month = Total Web Traffic / Number of Months
- = 860500 / 6
- = 143417 Page Views
This means an average of 143k page views is received. The company can plan well to implement digital marketing strategies to enhance future web traffic. This analysis is highly important for businesses to properly plan their web traffic.
12. Project Management
The last business application in this list is project management. Effectively managing projects is necessary and it involves standard quality, optimum cost, and timely completion. Calculating the average project cost, and average task completion time is vital to identify the performance.
Let’s look at the following example:
A company’s renovation project details include the following data:
Renovation Project Cost
- Material Purchases - $52410
- Contractor Payments - $45000
- Labor Cost - $35200
- Equipment Cost - $13700
- Total Project Cost = $146310
Average Project Cost = Total project cost / Number of categories
- = $146310 / 4
- = $36577.5
Time Taken for 175 Work Tasks Completed
- Project Initiation – September 15, 2023
- Project End – March 15, 2024
- Project Duration – 6 Months
Average Time Taken for a Renovation Task = Project Duration / Total Tasks Completed
- = 6 Months / 175 Tasks
- = 0.034 Months or one day per task (Utilize our Time Converter to quickly convert between different times)
According to the project manager’s status, the expected project completion was 8 months, and the expected average cost per task was $40000. However, the actual average time and cost are lower than the predicted average. This means the project has been completed 02 months before expected and with an average saving of $3422.5.
Step-by-Step Guide to Leverage an Average Calculator
Leveraging an average calculator is super helpful in doing the calculations for the above-mentioned business applications. Now, let’s see the step-by-step process of using Smart Tools AI’s Average Calculator for this purpose:
- Step 01: When you visit the Average Calculator page, you will need to enter different figures in the text boxes given.
- Step 02: If you have several numbers to calculate the average then you have to choose the ‘Add More’ button to enter as many numbers as you want.
- Step 03: Click the “Calculate” Button to get the following results
Result:
The result for a set of 4 numbers like 455, 655, 120, and 488 is in the below table
| Count | 04 |
| Average | 429.5 |
| Geometric Sum | 363.46570678559 |
| Harmonic mean | 283.54650350446 |
| Median | 488 |
| Largest | 655 |
| Smallest | 120 |
| Range | 535 |
Here you can understand that apart from just average, you can also identify the range, harmonic mean, geometric sum, count, and many other important metrics by using this calculator.
This will help you with various business applications as discussed in the above sections. The steps are very easy to follow and you can enter as many numbers as you want.
Final Thoughts
An average calculator is helpful to quickly and accurately find average values. This is important for businesses where they deal with different average calculations in their day-to-day business operations.
Further, an average calculator is applicable in many major business areas and this article has covered 12 major business applications such as budgeting, sales performance, quality control, finance analyses, and many more.
FAQs
Q1: What do you mean by average?
Average is the center or middle value of a total value of a certain set of numbers.
Q2: What is the formula to calculate the average?
The average is normally calculated by using the formula.
- Average = Sum of the given numbers / Total numbers
Q3: How average calculator help businesses?
The average calculator is used to identify average values in different business applications such as sales performance, budgeting, project performance, etc.
Explore Related Posts
https://smarttoolsai.com/post/practical-uses-of-a-discount-calculator-in-different-business-sectors